Type
Brian Hernandez
FrontEnd Developer
Chrome DevTool Features To Improve Your Front End Development Part II
Introduction
Google Chrome DevTools is a tool many front end developers use daily to make their development work flow much easier. Like so many of the tools we use, however, most of us probably learned just enough of the basics to get by. We all understand there are greater work flow improvements to be gained if we invested the time and effort in learning more features tools like these can do for us. But that’s the thing, more time and effort… ugh. Well, here’s an article that attempts to minimize that effort and shares a few of the more useful features in Chrome DevTools that I've found.
Debugging
In this second part, I'll share some features that will make debugging your JavaScript code in DevTools easier. Check out Part 1 if you missed it.
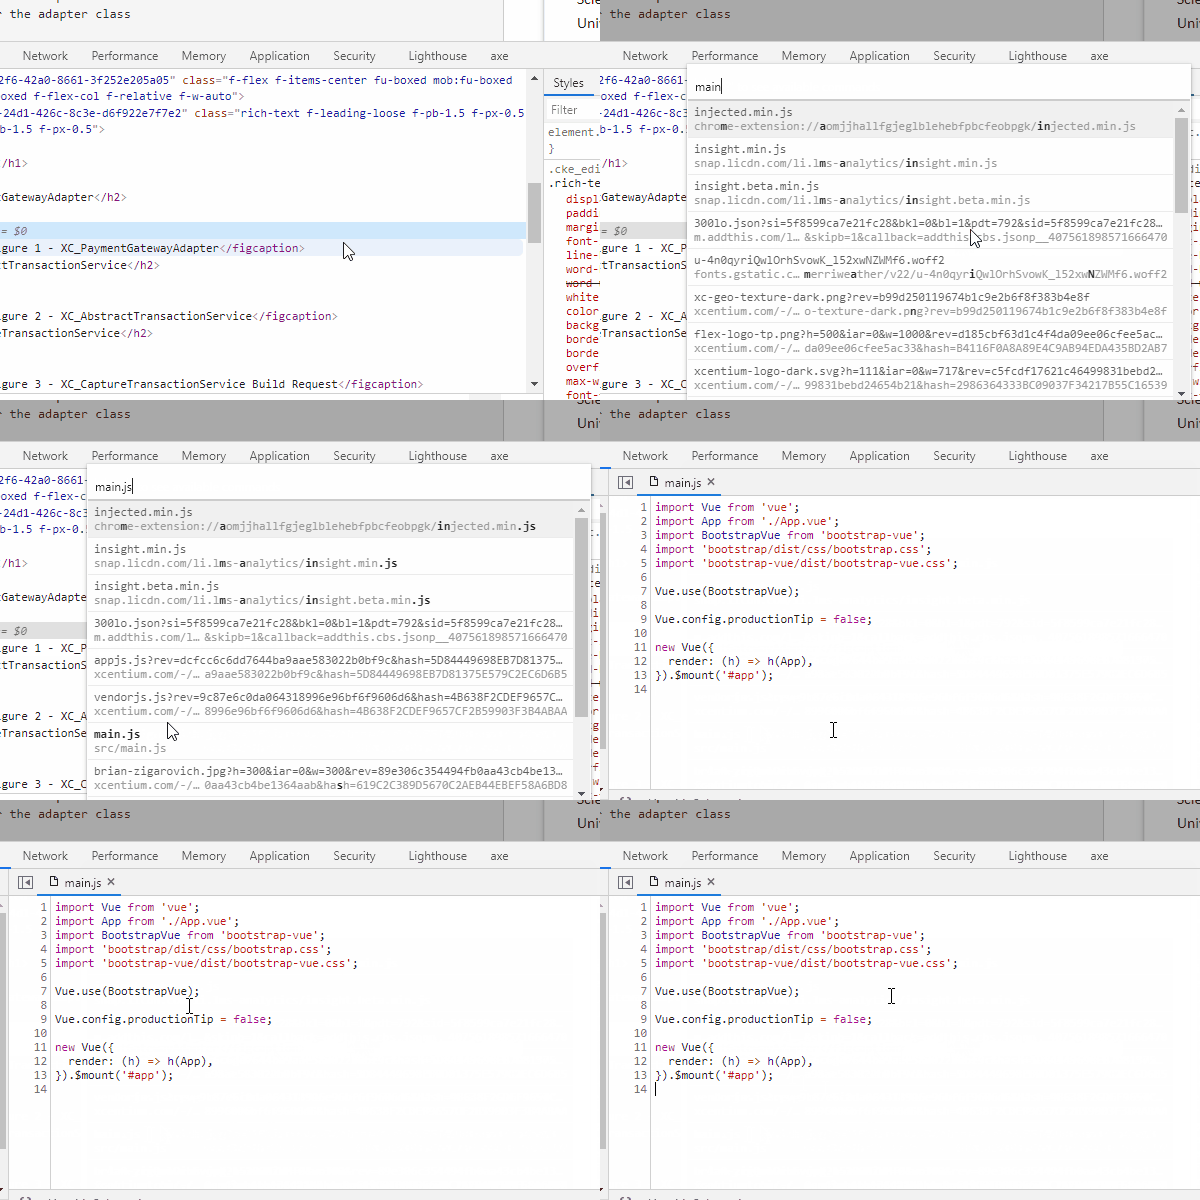
Fuzzy Search File Names
While on any tab in DevTools, pressing ctrl + p (cmd + p for MacOS) will open up a search dialog where you can perform a fuzzy search for file names.
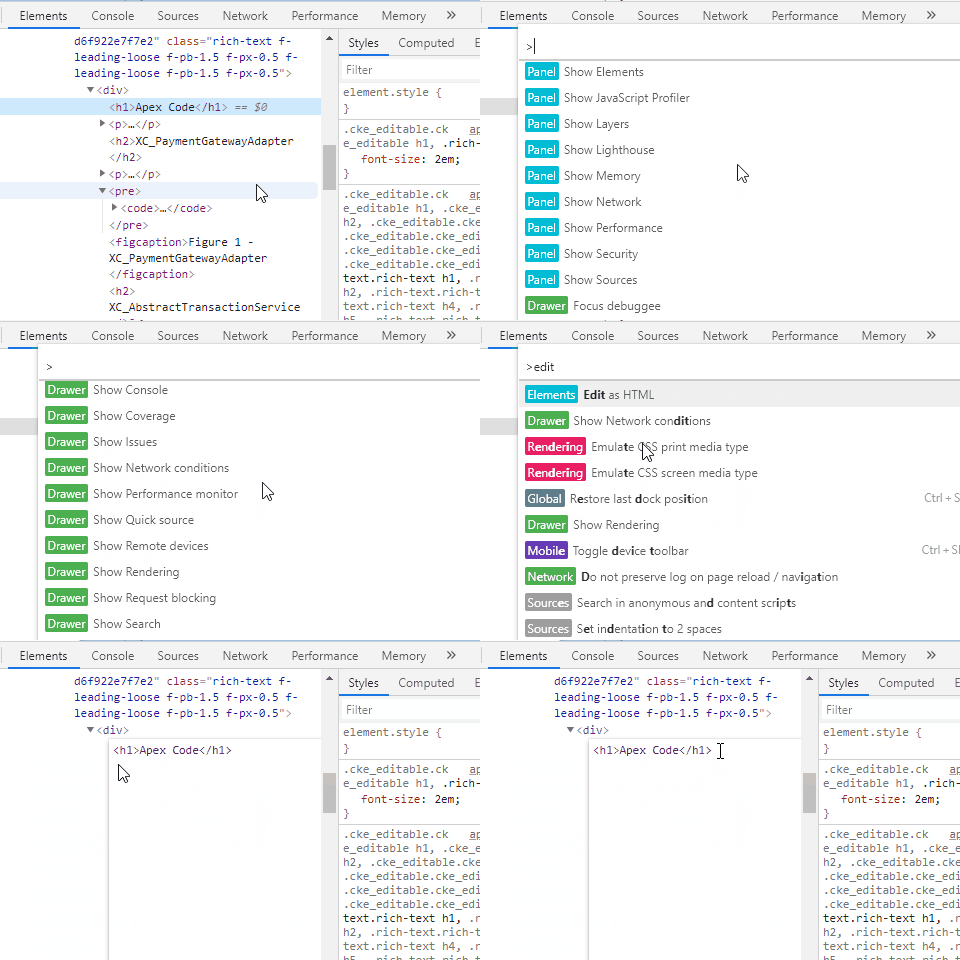
Go To Anything Command List
Again, on any tab, pressing ctrl + p (cmd + p for MacOS) opens a "Go To Anything" type of dialog with a list of commands that can be searched for and executed by clicking on them.
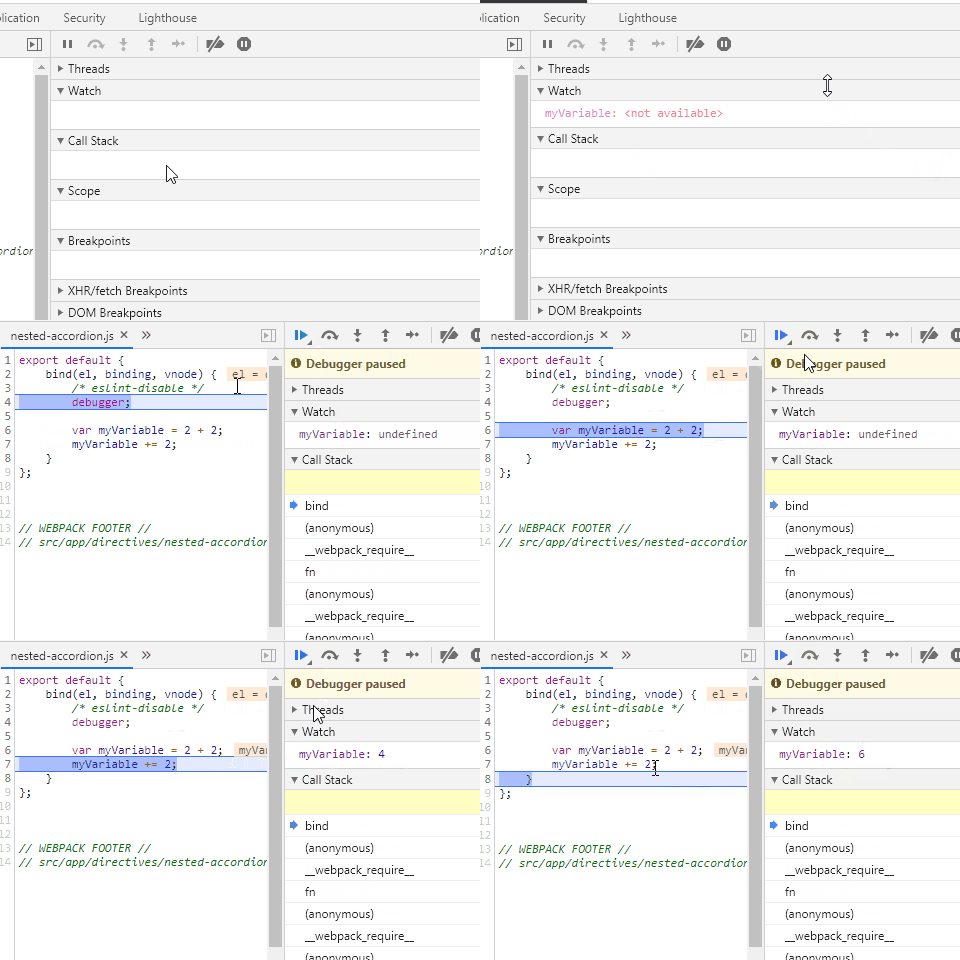
The debugger Keyword
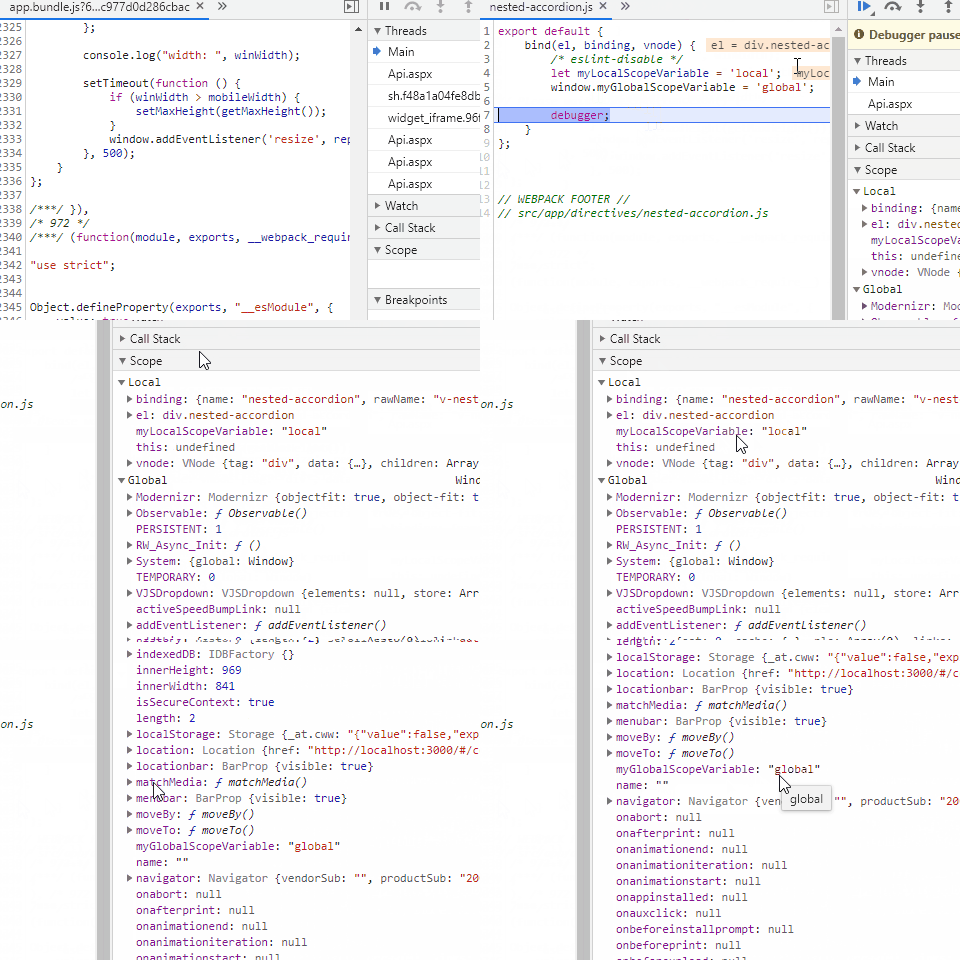
Adding the keyword debugger; anywhere in your JavaScript files will add a breakpoint in DevTools at that same location. Just a convenient and alternative way to add break points.
Watch Panel
For the rest of these features, we'll be looking at the different panels that are found under the Sources tab. So, make your way to the Sources tab, then slide open the the Watch panel. In the Watch panel, you can add variables or expressions you’d like to "watch" to see what they are evaluating to as you step through your code in real time (more on this below).
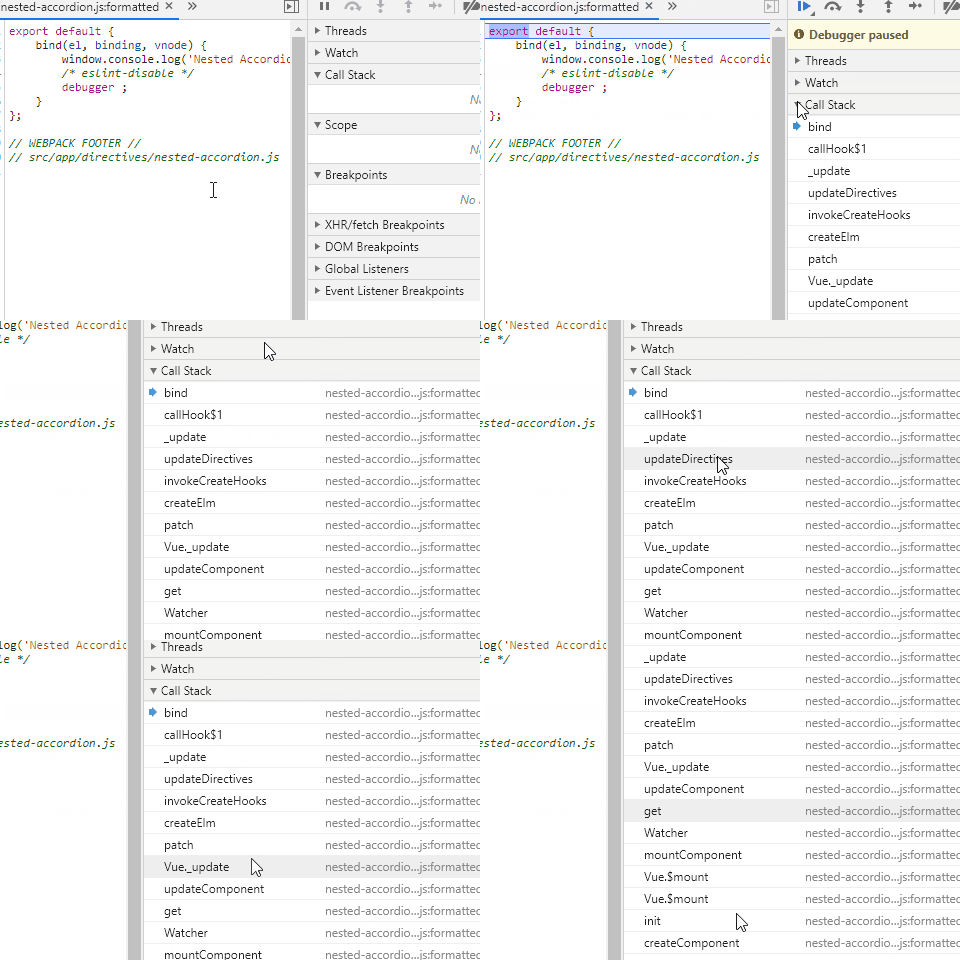
Call Stack Panel
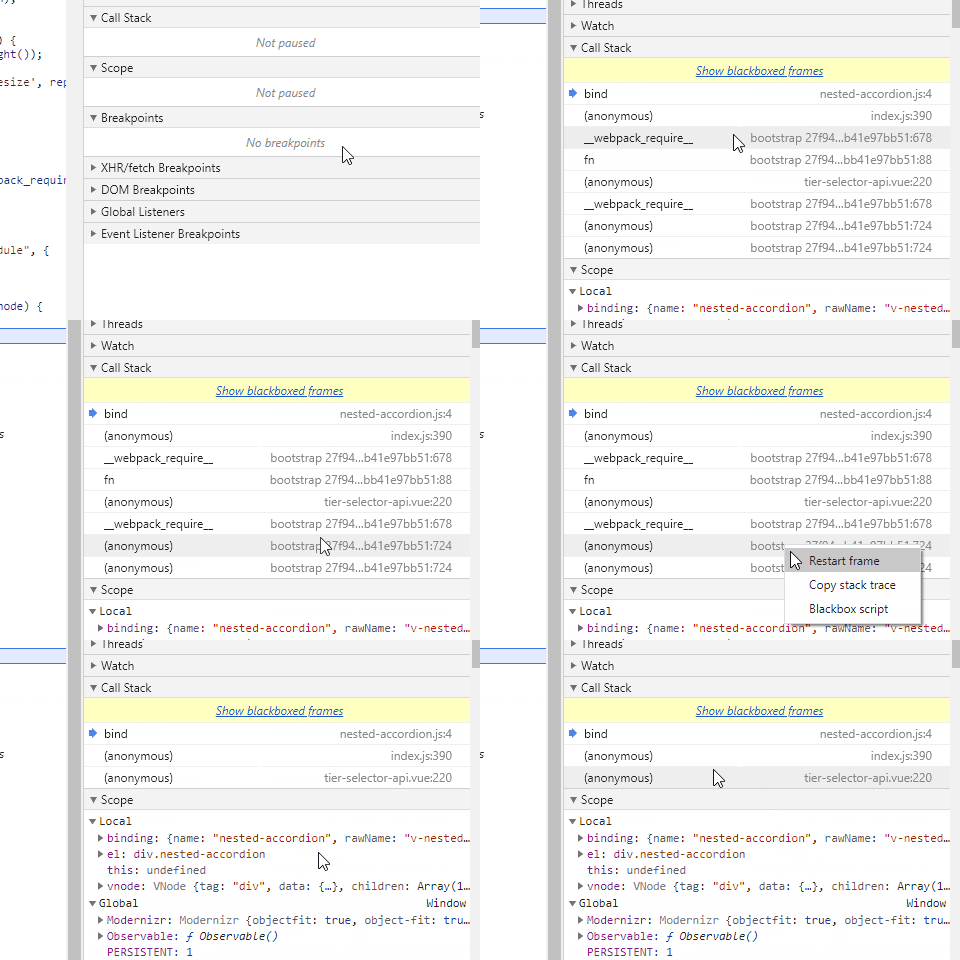
When at a breakpoint, or stepping through your JavaScript code, you can view the call stack to see the history of functions that were called that brought the script execution to the current point you are at.
Scope Panel
This panel is further divided into Local and Global scopes, among others, showing you which functions and variables you have access to in that particular scope.
Stepping Over, In, and Out Of Functions
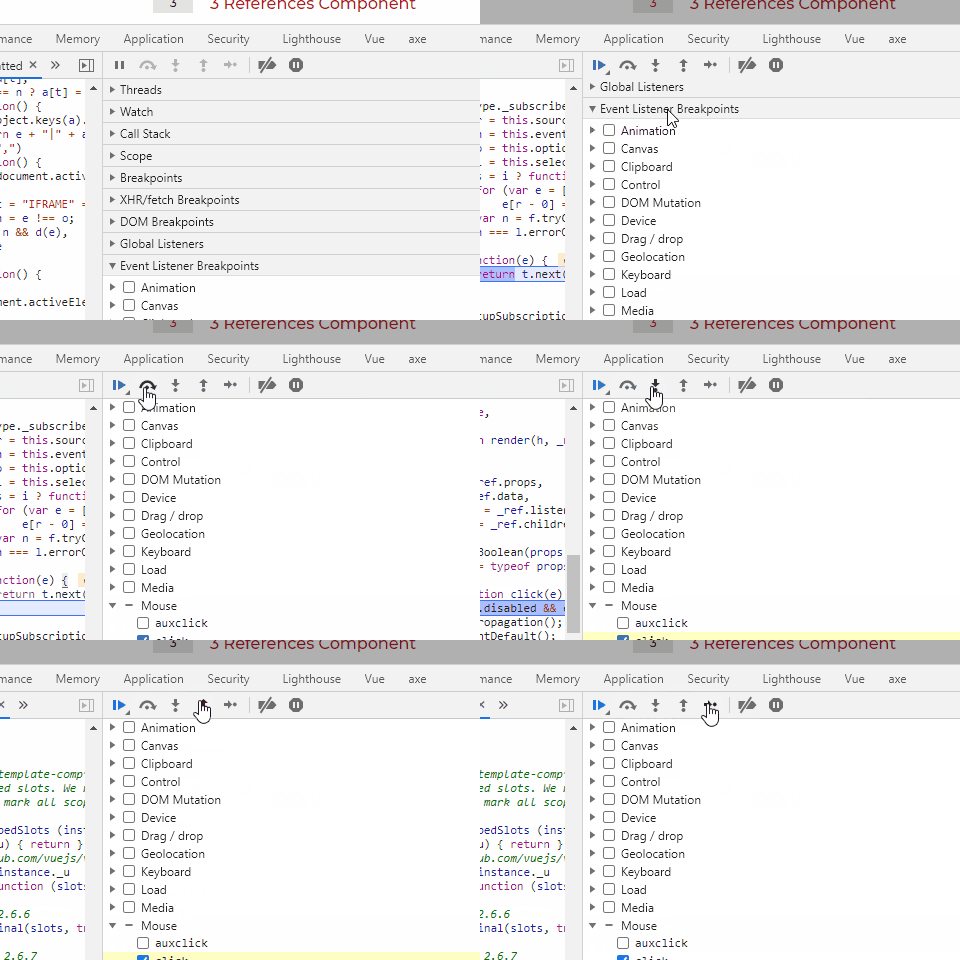
Using the three panels mentioned above along with these different ways to step through functions can really assist you in debugging your JavaScript code. The Step Over command (F10 key) will let you execute a function and "step over it" to save time. This can be useful when you are trying to get to a particular part of the script execution without having to wade through the details of each function. The Step In command (F11 key) will let you "step into" the current function to then step through the execution of that function line by line if you wish. The Step Out command (shift + F11) will let you "jump out" of a function that you previously stepped into if you wish to stop going through each line of that function. Once you are done stepping through your code, you can resume the code execution by pressing F8 key or the blue play button all the way to the left shown below.
Blackboxing Scripts
Sometimes when looking through the call stack of your code you’ll see function calls from third party JavaScript libraries you’re using. Having to step through these third party scripts you've never authored, which are likely not the source of the errors you are tracking down, is time consuming. You can easily prevent having to step through these third-party libraries by "blackboxing" them. Right click a script in the call stack and select "Blackbox script", so DevTools can skip these scripts while you are debugging.
Conclusion
Making better use of these panels and their features will really level up your JavaScript debugging game. This will save you a lot of time tracking down bugs and limit the need to add a bunch of console.log() lines when you debug your code. In Part 3, I'll share some ways to monitor the network and page performance in DevTools.

