Type
Brian Hernandez
FrontEnd Developer
Chrome DevTool Features To Improve Your Front End Development, Part I
Introduction
Google Chrome DevTools is a tool many front end developers use daily to make their development work flow much easier. Like so many of the tools we use, however, most of us probably learned just enough of the basics to get by. We all understand there are greater work flow improvements to be gained if we invested the time and effort in learning more features tools like these can do for us. But that’s the thing, more time and effort… ugh. Well, here’s an article that attempts to minimize that effort and shares a few of the more useful features in Chrome DevTools that I've found.
Editing
In this first part, I'll share some features around viewing and editing in DevTools.
Color Palettes
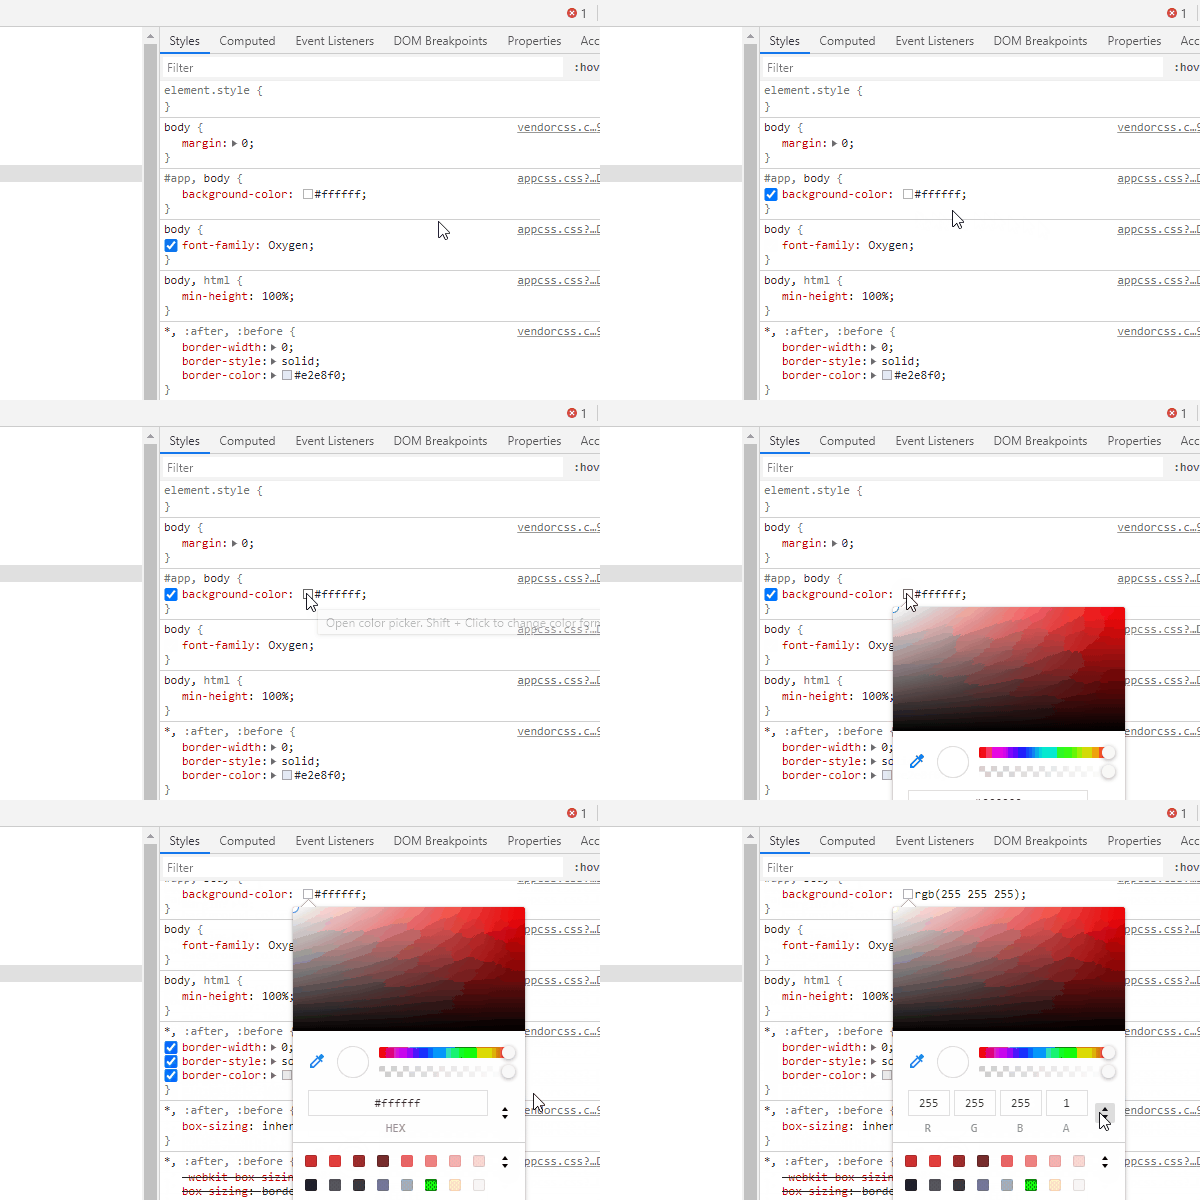
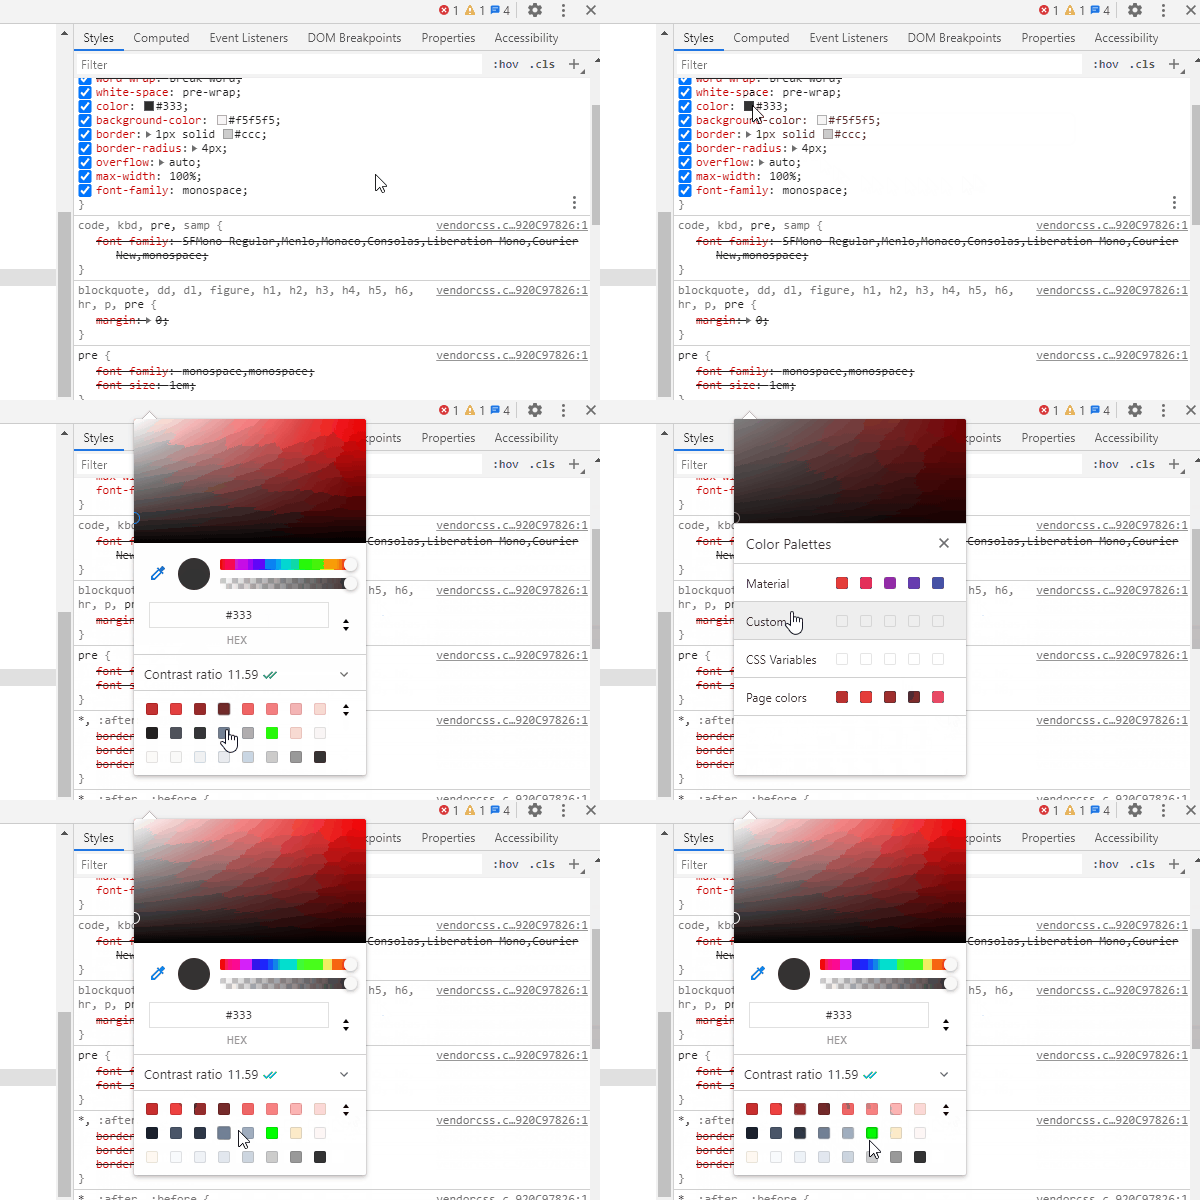
Click any color swatch in the styles tab to reveal the color picker. Then click the up and down arrows next to the color swatches to reveal a collection of color palettes, the first group is DevTools' built in Material Theme color palette. The last group are colors found on the page you are viewing.
Color Formats
Hold down the shift key and click any color swatch in the styles tab to cycle between color formats. Opening the color picker and clicking the up and down arrows next to the color value will also cycle through color formats. There’s no longer a need to visit any of those color format conversion sites.
Select Elements
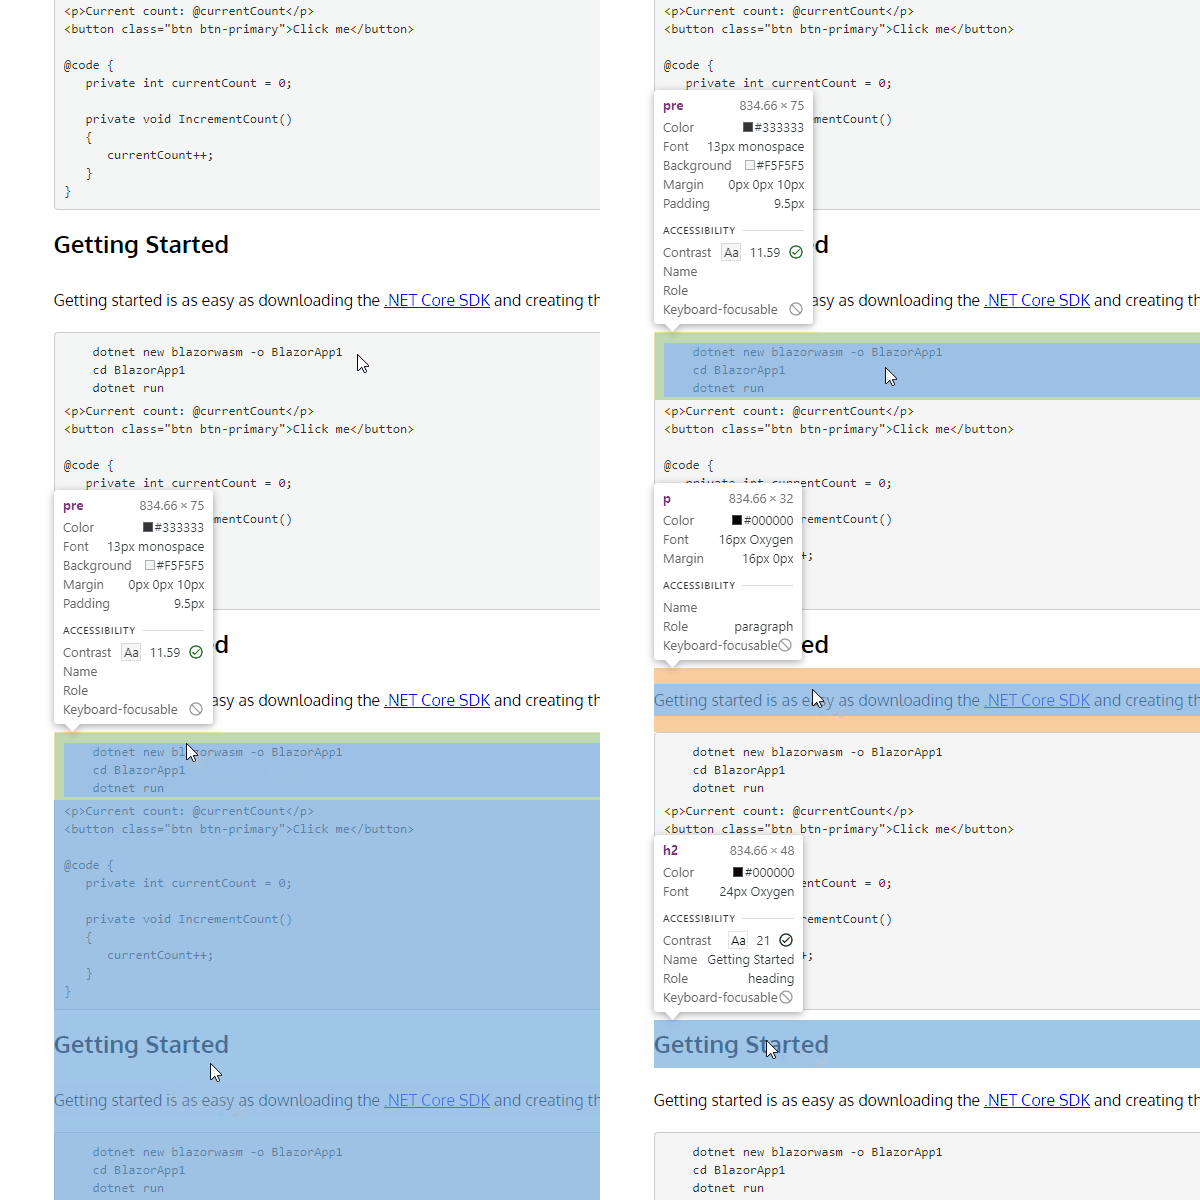
Press ctrl (cmd for MacOS) + shift + C when viewing a page to highlight and select DOM elments. Before selecting an element, notice how a tooltip box will pop up with useful information about the currently hovered element. When applicable, the tooltip will show the accessibility contrast value for the color of text against its background. This is something I've found very handy recently.
Show/Hide Elements
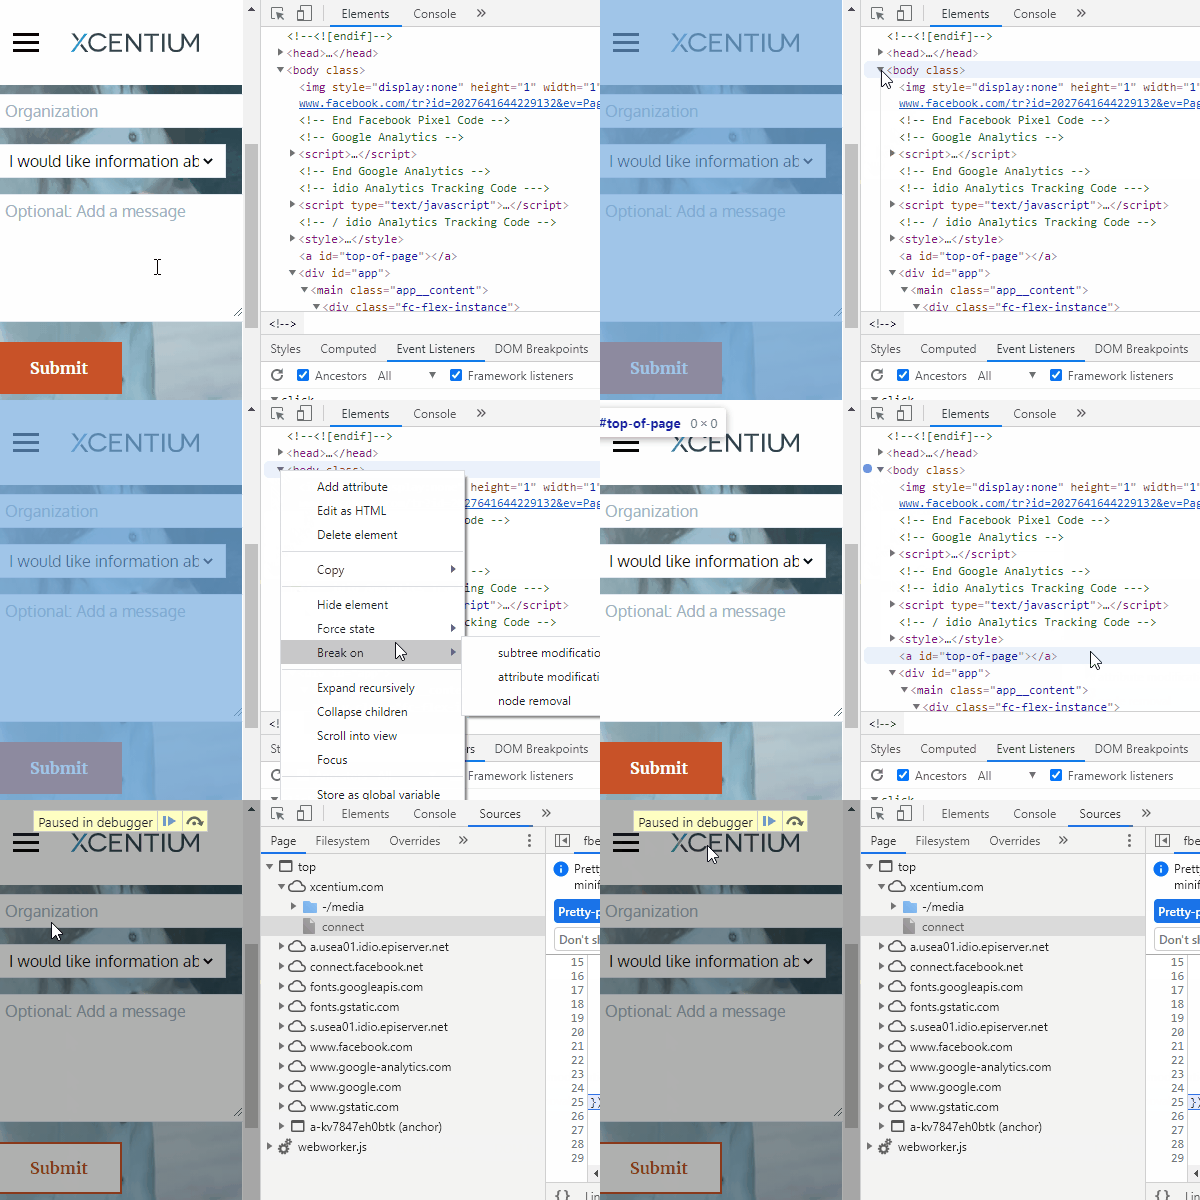
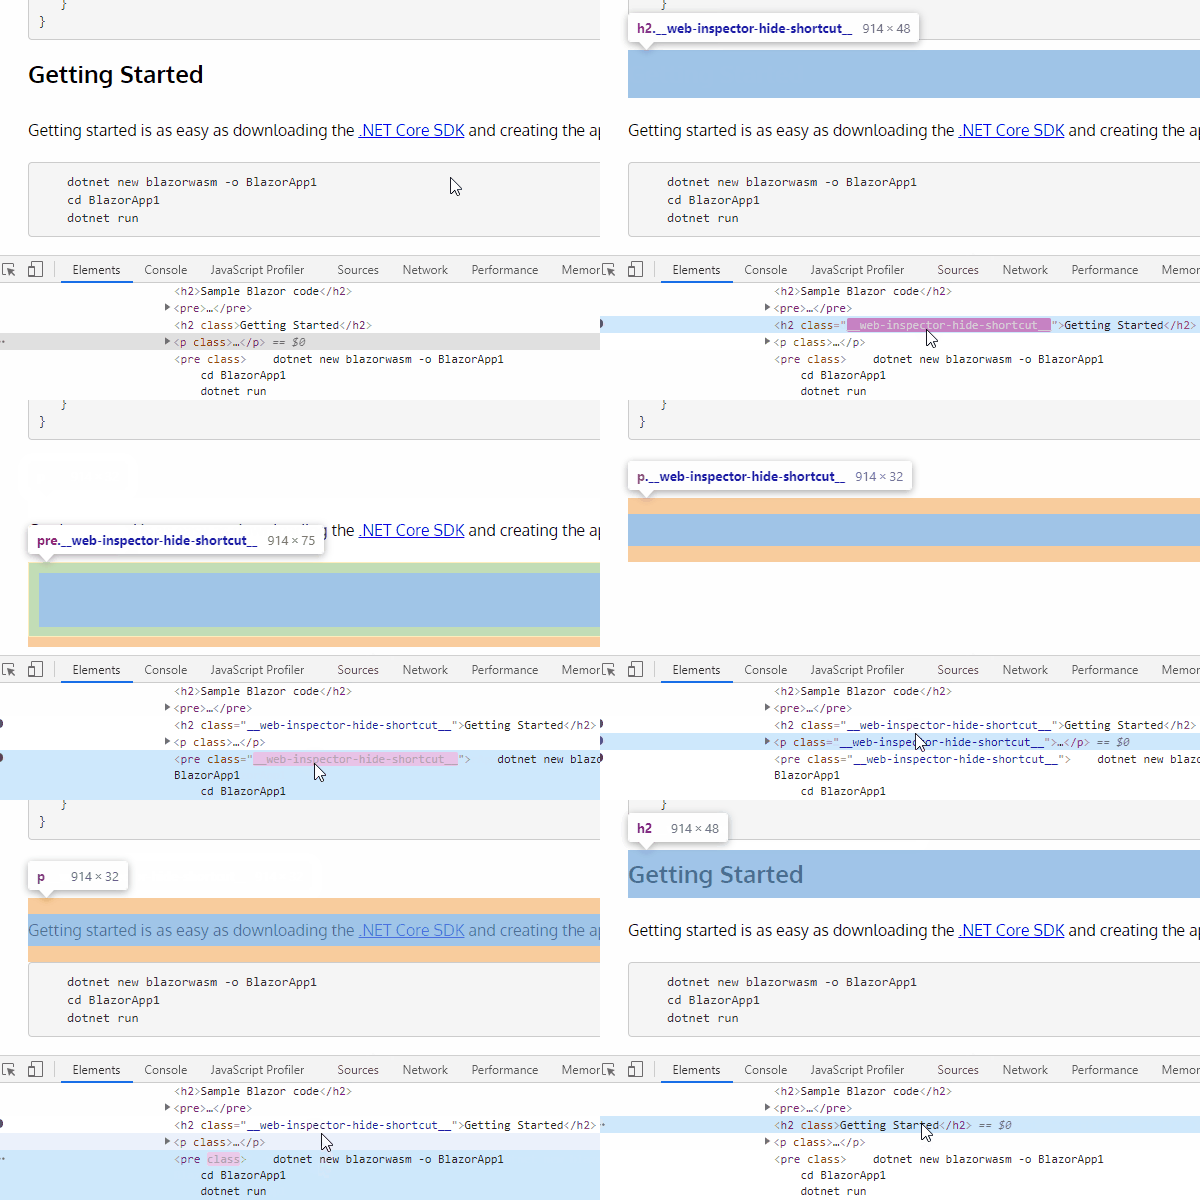
Select a DOM element in the elements tab and press the H key to toggle the elements visibility on or off. This still preserves its space in the document flow it holds, only its visibility is toggled.
Expand Nested Elements
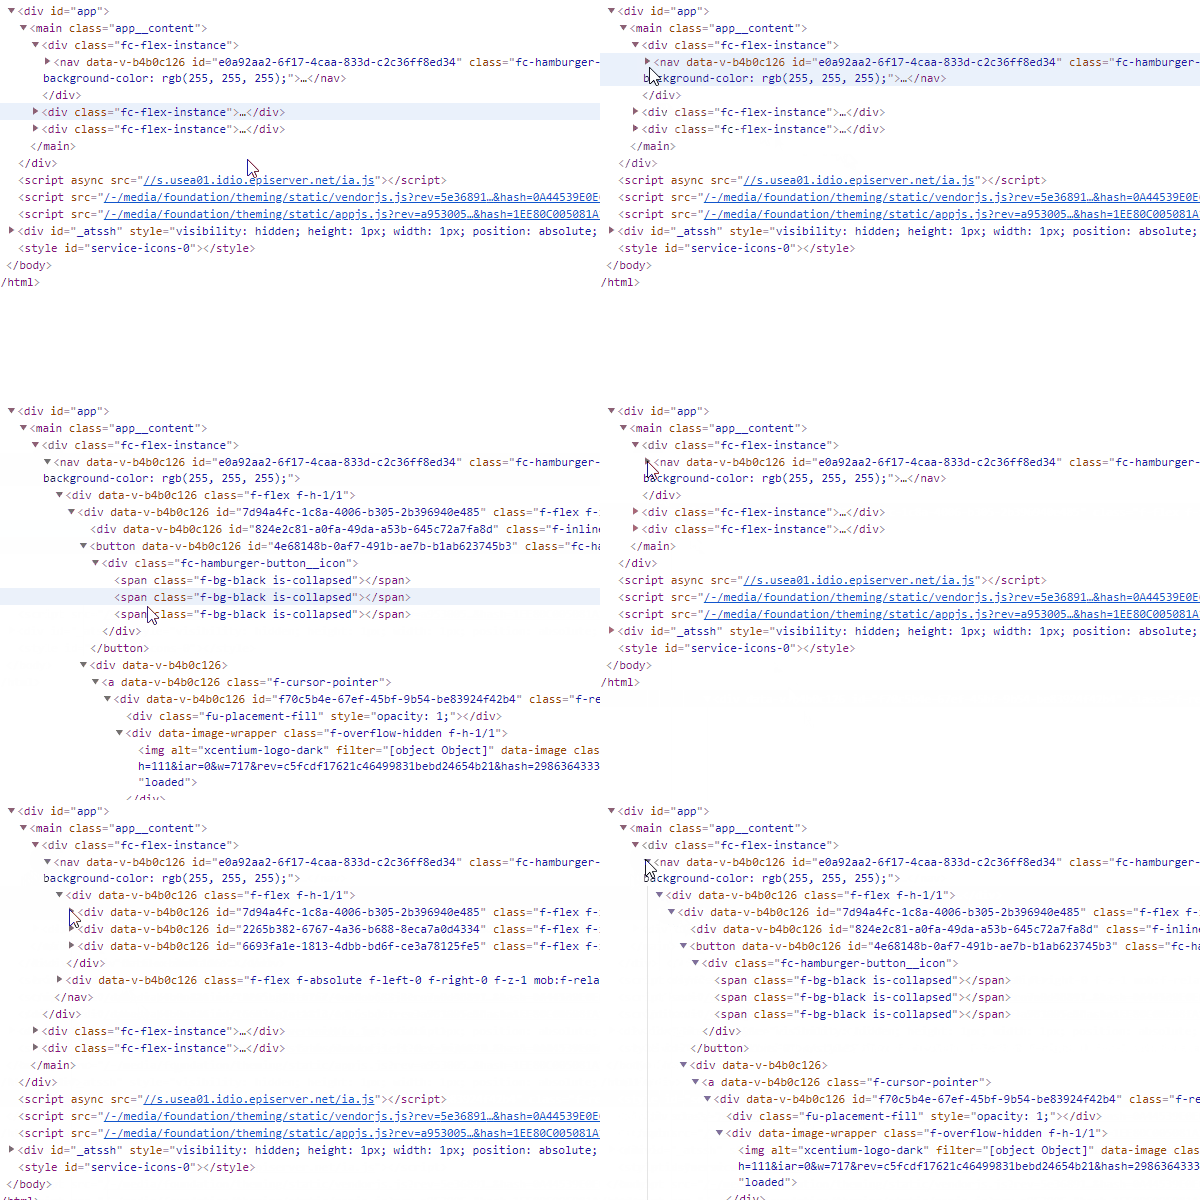
When viewing the markup in the Elements tab, hold down the alt key and click a DOM element to expand it along with all its child elements.
Scroll Into View
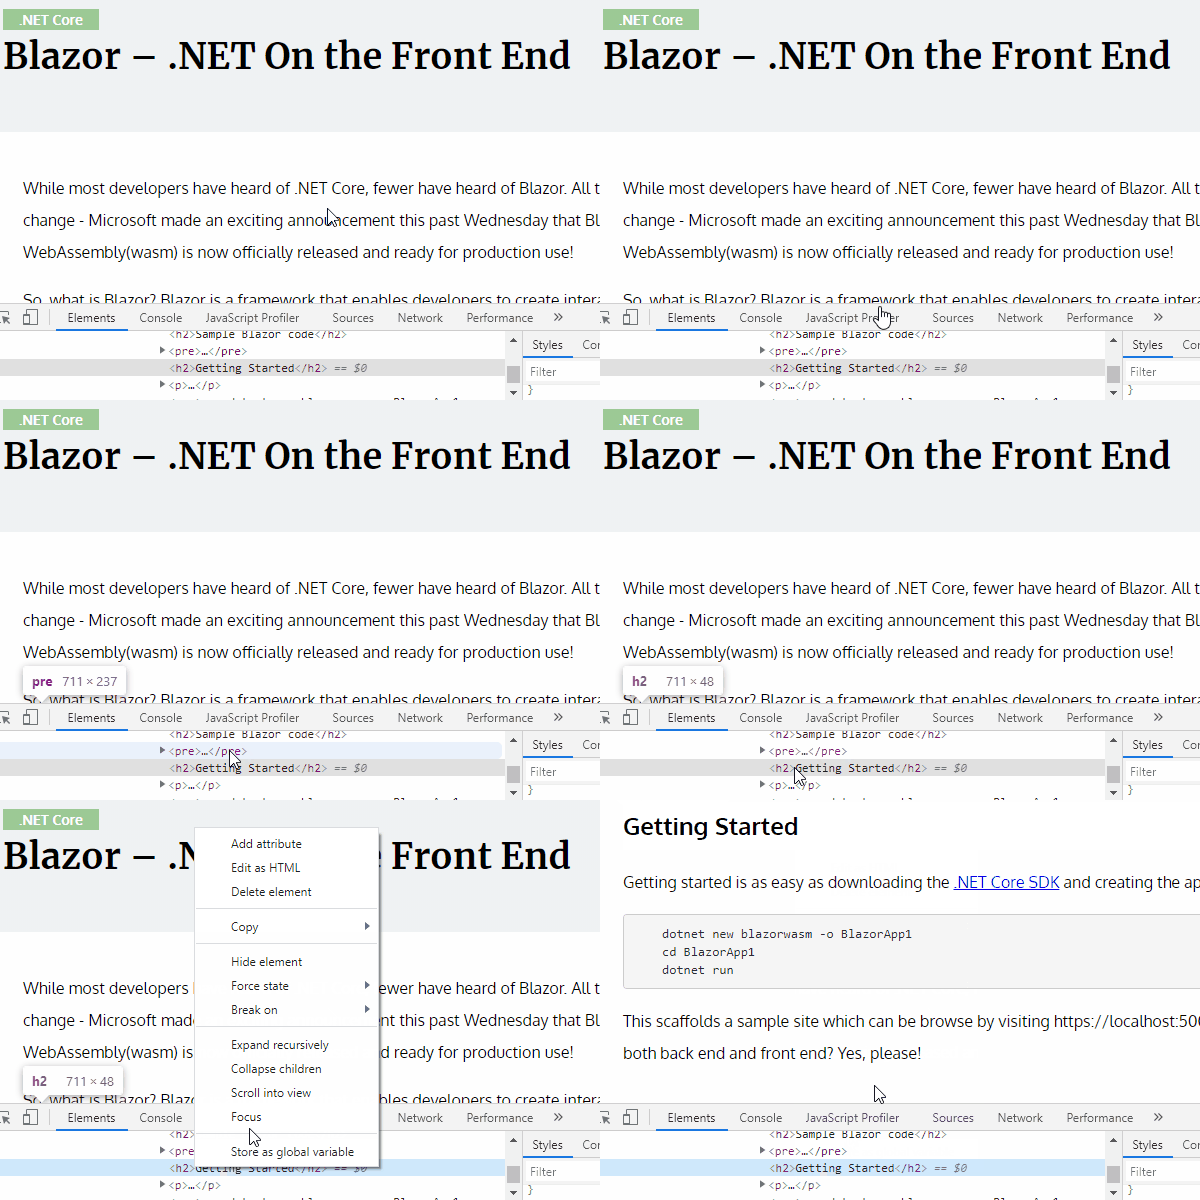
Right click a DOM element within the Elements tab and select “Scroll into view to…” to scroll that element into view! Just an easy way to quickly see what you are working on if you've scrolled away from it.
All Event Listeners
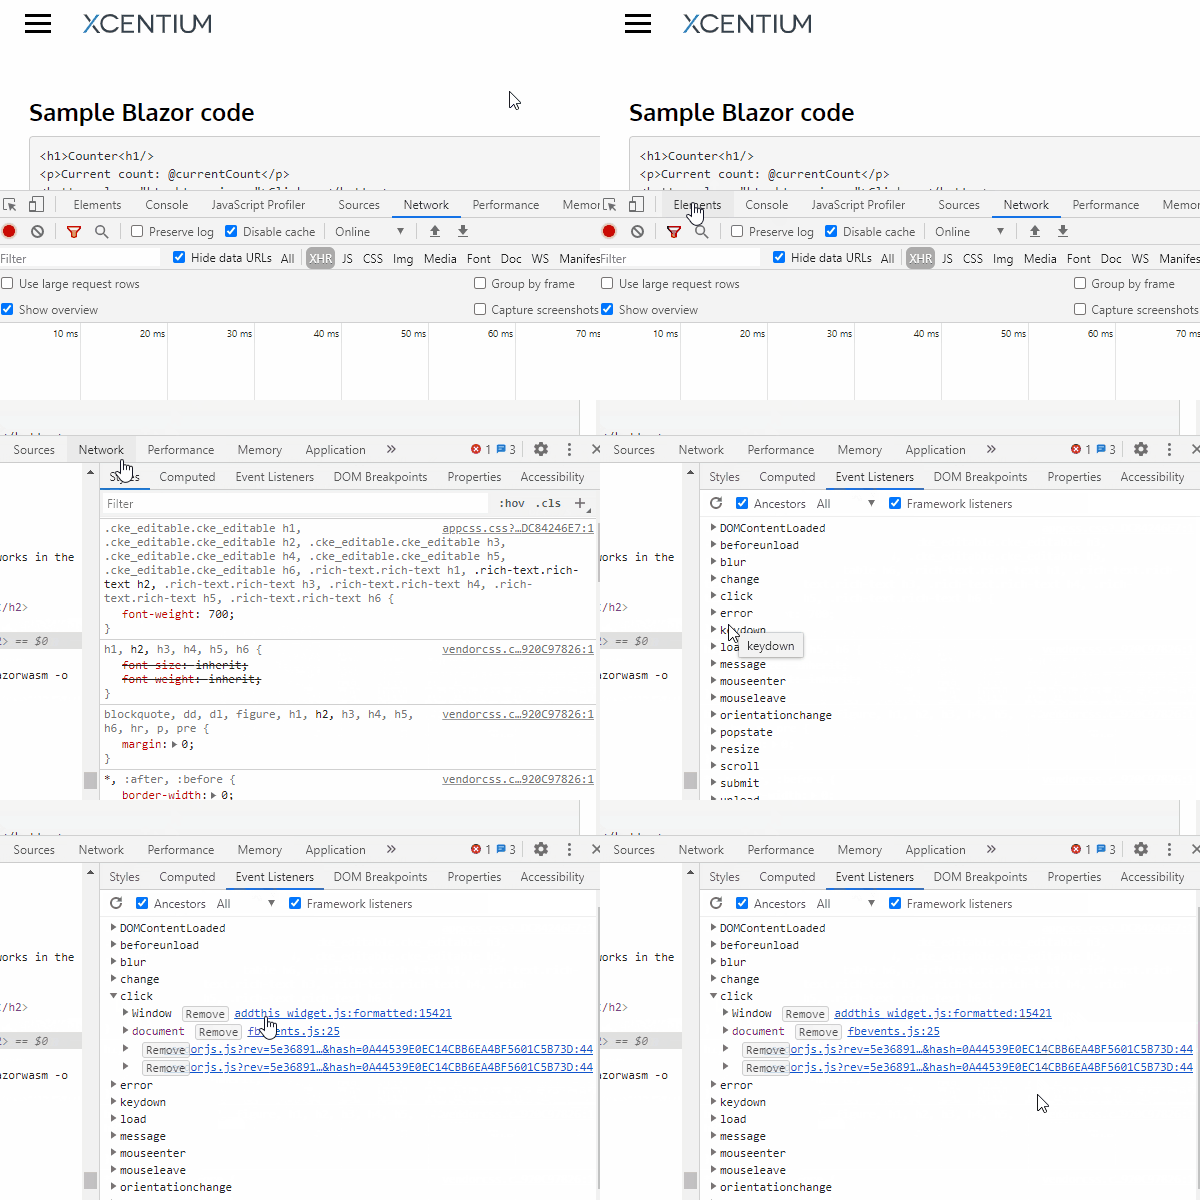
In the Elements tab, activate the Events tab (to the right of the Styles and Computed tabs in the default layout) to see a list of all the JavaScript events on the current page.
DOM Breakpoints
You can add a DOM based breakpoint in the Elements tab by right clicking any DOM element, highlighting “Break on” and choosing “subtree modifications”, “attribute modifications”, or “node removal” depending on which type of DOM breakpoint you’d like to add to the element. This is a quick way to add breakpoints to your JavaScript when you know which element is being manipulated but are unclear where in your JavaScript the manipulation is occurring.
Save Changes In Work Spaces
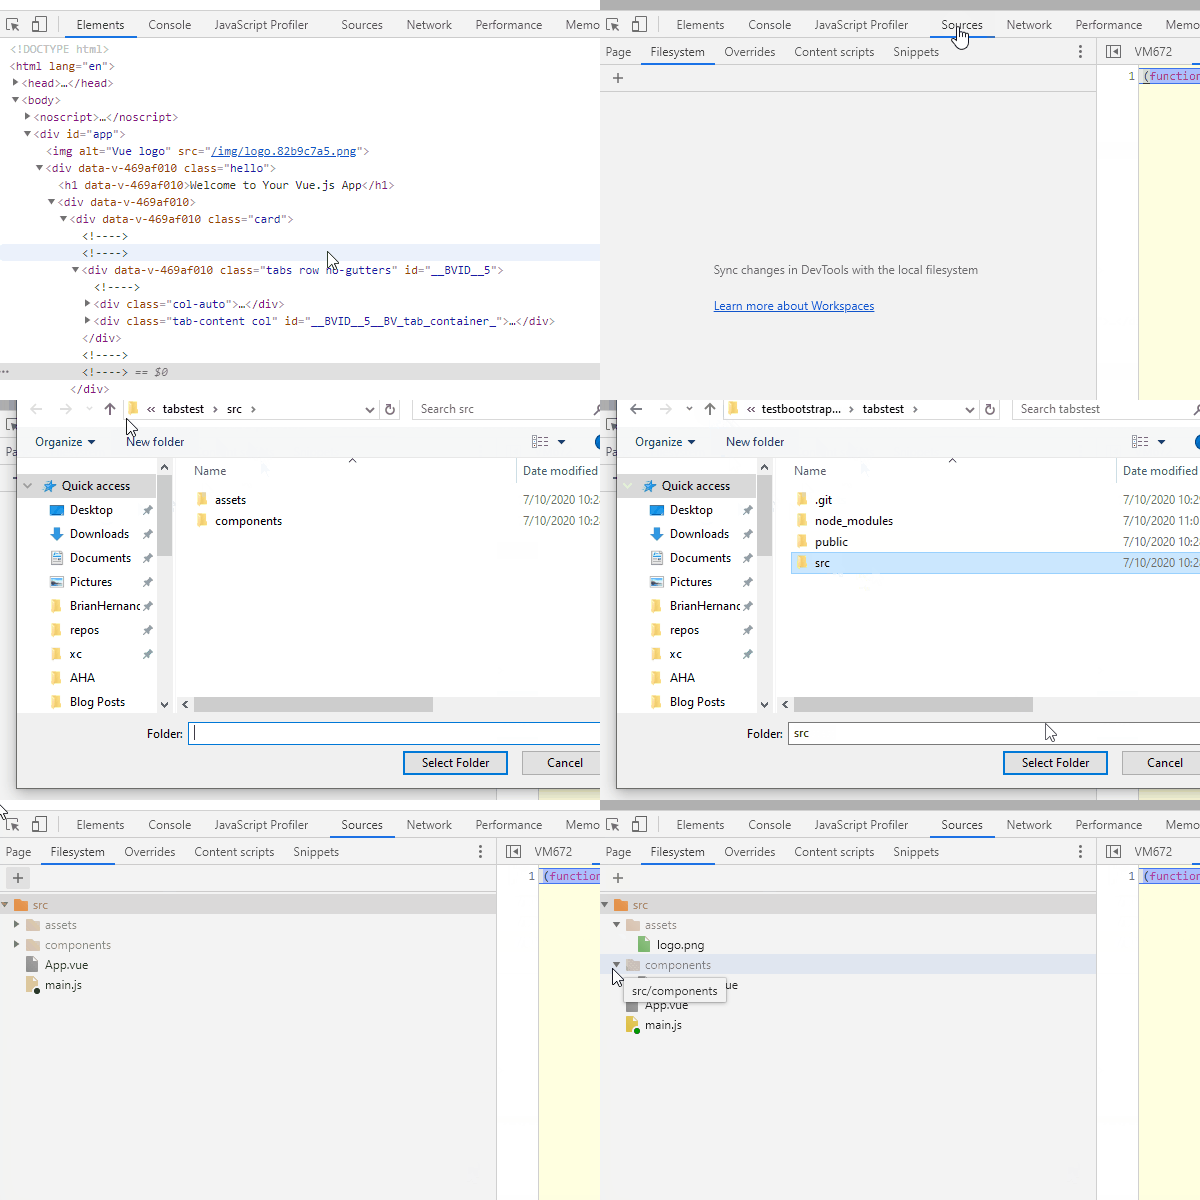
The edits you make to the CSS and JavaScript in DevTools can be saved to disk by adding a folder to the DevTools Work Space. Under the Sources tab, activate the Filesystem tab. Then choose to add your project’s folder to the work space. DevTools will analyze the files in the folder you select, match the JavaScript and CSS changes you make to their appropriate files and save them. Changes to elements in the Elements tab will NOT be saved as this is not really HTML from a file but Chrome’s DOM representation of the HTML it parsed.
Bring Up The Console Anywhere
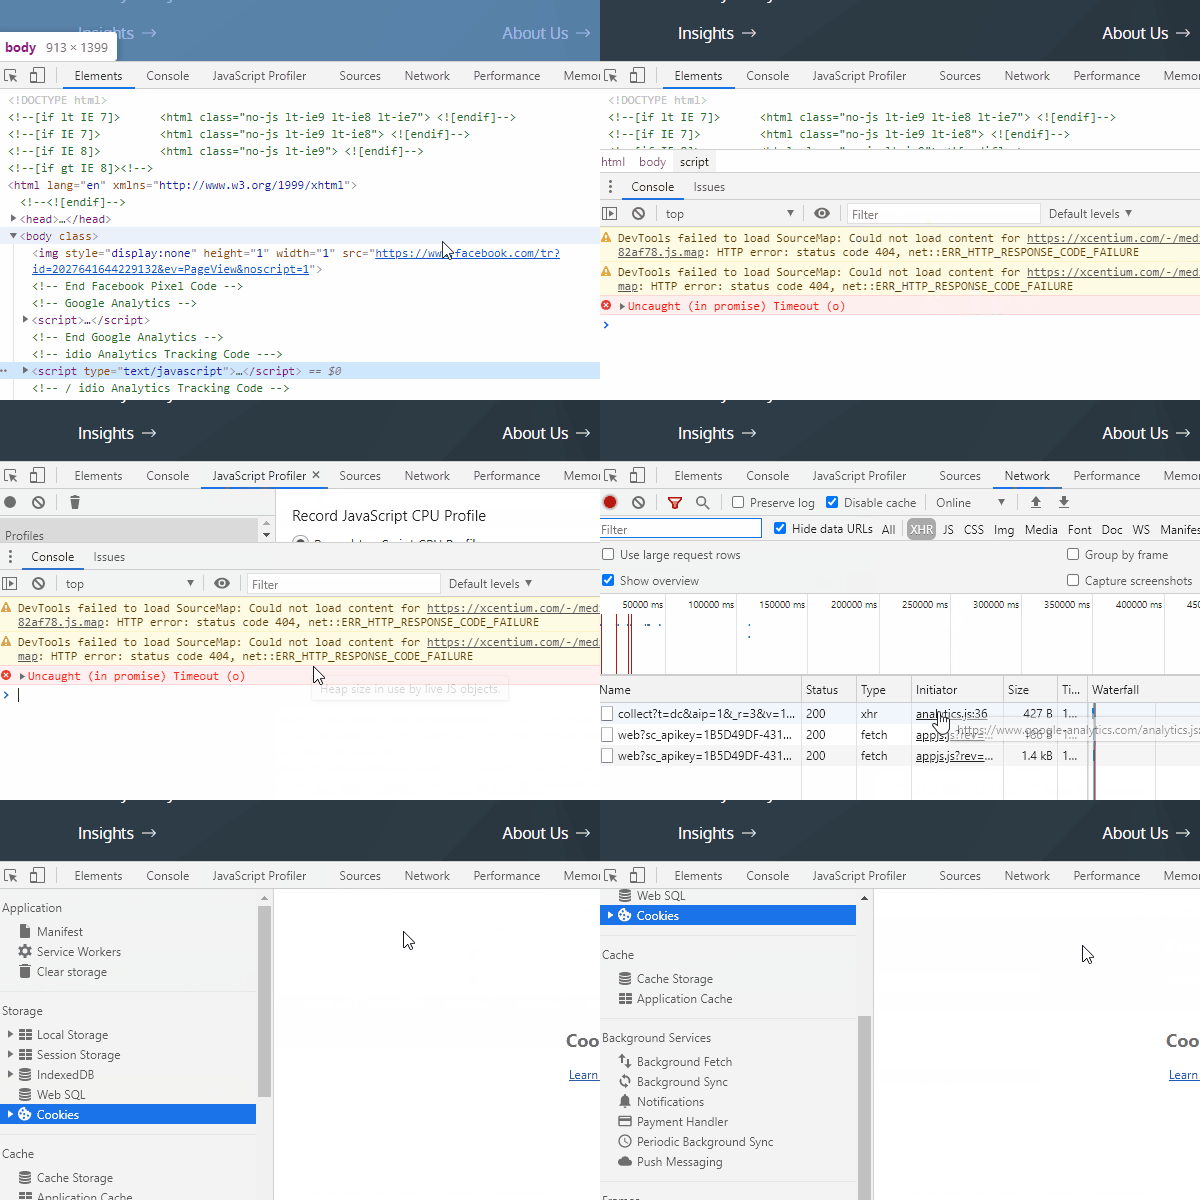
You can bring up the JavaScript console in any DevTools panel you are in (except the Console tab itself) by pressing the esc key. Pretty handy for quickly accessing the console while viewing other areas.
Recent Selection History
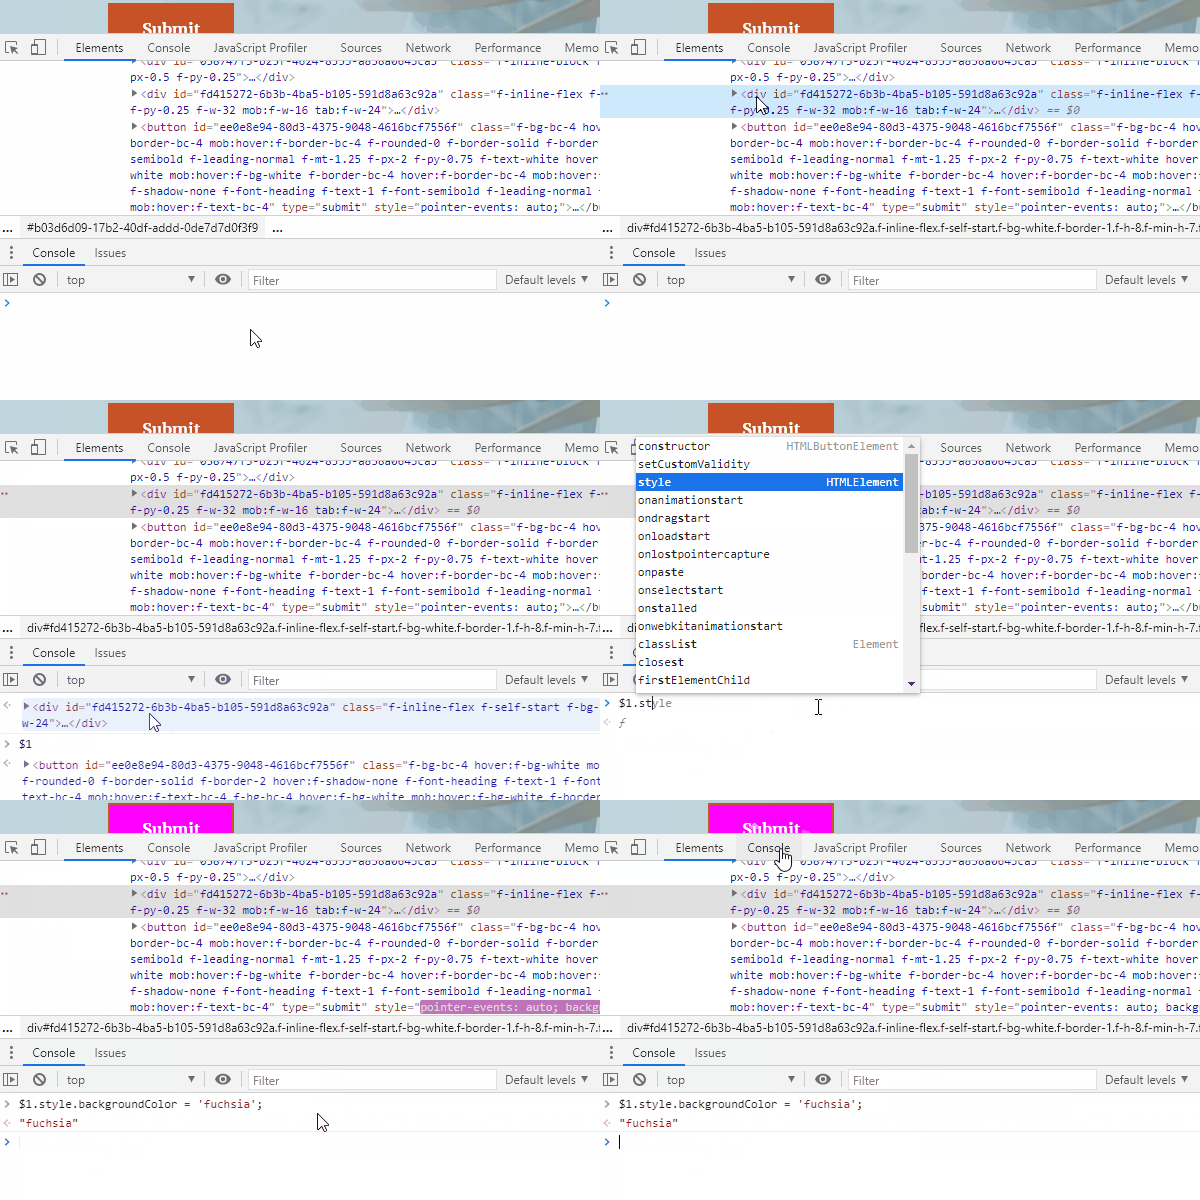
In the Console tab, $0 will represent the currently selected element in the Elements tab. DevTools will remember the history of the elements selected before the current element sequentially by increasing the integer. So $1 will represent the element selected before the currently selected element and so on. Combining this with bringing up the console via the esc key as mentioned previously allows you to highlight and access any element with the $0 syntax to quickly write JavaScript targeted to the precise elements you want to target.
Conclusion
This, of course, is not an exhaustive list of all the viewing/editing features that Chrome DevTools offers, but a collection of features that I've found to be quite useful in my day to day front end development workflow. In Part 2, I'll share some more slick features DevTools provides us on debugging JavaScript.

