
Type

Brian Hernandez
FrontEnd Developer
Chrome DevTool Features To Improve Your Front End Development Part III
Introduction
Google Chrome DevTools is a tool many front end developers use daily to make their development work flow much easier. Like so many of the tools we use, however, most of us probably learned just enough of the basics to get by. We all understand there are greater work flow improvements to be gained if we invested the time and effort in learning more features tools like these can do for us. But that’s the thing, more time and effort… ugh. Well, here’s an article that attempts to minimize that effort and shares a few of the more useful features in Chrome DevTools that I've found.
Networking & Performance Monitoring
In this final part, I'll share some useful DevTools features around monitoring the network traffic and performance of your site. Check out Part 1 and Part 2 of this series if you've missed them.
Color Codes For Network Diagnostics
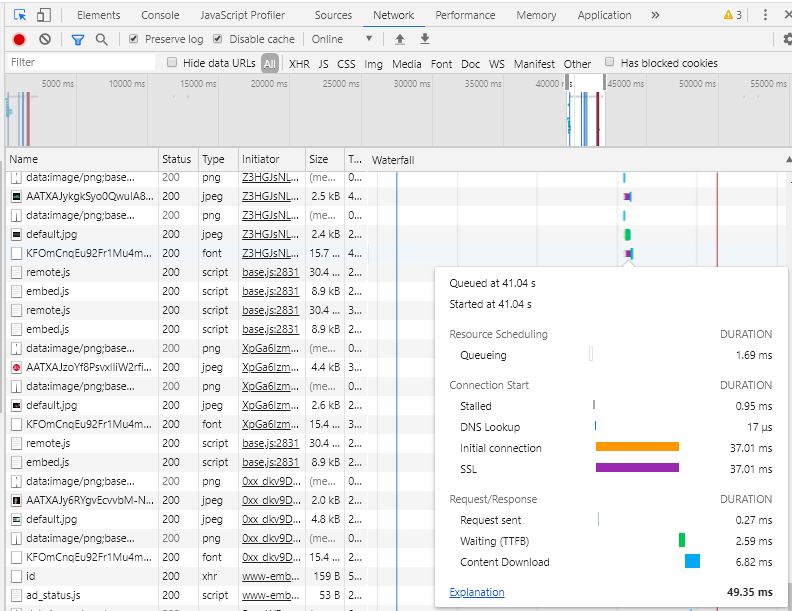
The Network tab only records network activity when it has been opened. So, if you want to review the network activity when first visiting your page simply refresh the page after you open the network tab. Using the Waterfall column of the recorded network activity, you can visually diagnose potential network issues based on the colors of the bars in this column to where they may be happening in the network stack. Visible green and blue bars are common, green signifying the time waiting for content to be downloaded and blue for the time it took to download the content. Other colors like purple represent the SSL handshake duration, orange for initial connection duration, teal for DNS lookup time, gray for the time the request stalled or was blocked, and white for time the request spent in the browser queue. You can use this as a visual guide to quickly see where a network issue may be concentrated at to narrow down your debugging efforts. See the image below as an example.
Preserve Log
Have you ever tried to debug an issue and have seen a flash of that red JavaScript error log to the console only for the page to be redirected and the error vanish before you had a chance to read it? Well, there’s a way to prevent those error logs from disappearing on you between page navigations. You can toggle the "Preserve log" option on anytime you have the Console tab open, just click on the Console Settings gear icon to the far right in the top of the tab and you'll see it amongst other Console tab options. The Network tab itself has a very similar option immediately visible near its top. Checking the box "Preserve log" here will preserve the list of downloaded resources shown in the Network tab when navigating between pages.
Performance Monitoring
The Performance tab in DevTools can be used to measure the performance of your website or application. By following the Performance API (https://developer.mozilla.org/en-US/docs/Web/API/Performance), you can give names to different "marks" in your JavaScript code, then measure those marks against each other at different points in your code to view the elapsed time between them on the timeline of the Performance tab. Here is an example of measuring how long an API call takes to complete using this approach:
window.addEventListener('load', thingToMeasure);

function thingToMeasure() {
  window.performance.mark('start');
  fetch('/api')
    .then(result => result.json())
    .then(json => {
      json.images.forEach(image => console.log(image.name));
      window.performance.mark('end');
      window.performance.measure('How long it took for the thingToMeasure to complete', 'start', 'end');
    });
}
In the code above, we have a basic function called thingToMeasure() that is called once the page loads. First, we use the mark() method to create a timestamp labeled "start" before the API call. We then make the API call and once we get a response, we convert the response to a JSON object, then print the names of the images to the console. When the names are finished printing, we mark another timestamp with the label "end". We then use the measure() method to add a note or description to the difference between the two timestamps we chose to measure ("start" and "end" in this case). Now, we open the Performance tab in DevTools. To view performance, you’ll have to record a moment in time on the page that corresponds to the process you are trying to measure the performance of. Since the process we want to monitor happens on page load, we’ll simply start a recording, refresh the page, and then stop once it has finished loading. Then, we’ll find the elapsed time along with it’s note we set for it under the Timings strip in the Performance tab. This is a flexible way to add various performance measurements to your code base.
Monitor Page Repaints
Bring up the JavaScript console in any tab (except when in the Console tab itself) by pressing the esc key. Then, navigate to the vertical ellipsis menu and choose "Rendering" to activate the Rendering tab. If you are already on the Console tab, you’ll have to take the extra step of hovering over the "More tools" options within its vertical ellipsis menu to see the "Rendering" option. Once the Rendering tab is open, check the "Paint flashing" checkbox. This will highlight areas of the page in green that are being repainted. This is one way to evaluate code efficiency by monitoring unnecessary page repaints.
Identify Page Jank
If areas of your site seem to be performing slow, open the Performance tab and record a performance session for that particular page. If you see red lines in places along the timeline, that’s a sign of frames being dropped. You can further investigate the cause by reviewing the functions being called at that given point in time under the Main strip to narrow down which function the performance bottleneck is happening in.
Conclusion
Of course, this was not an exhaustive list of features Chrome DevTools has but a collection I thought could greatly improve a front end developer’s workflow efficiency if they weren’t aware of them before. Becoming more familiar with the tools of our craft, little by little, will always aid us in building a better web experience.